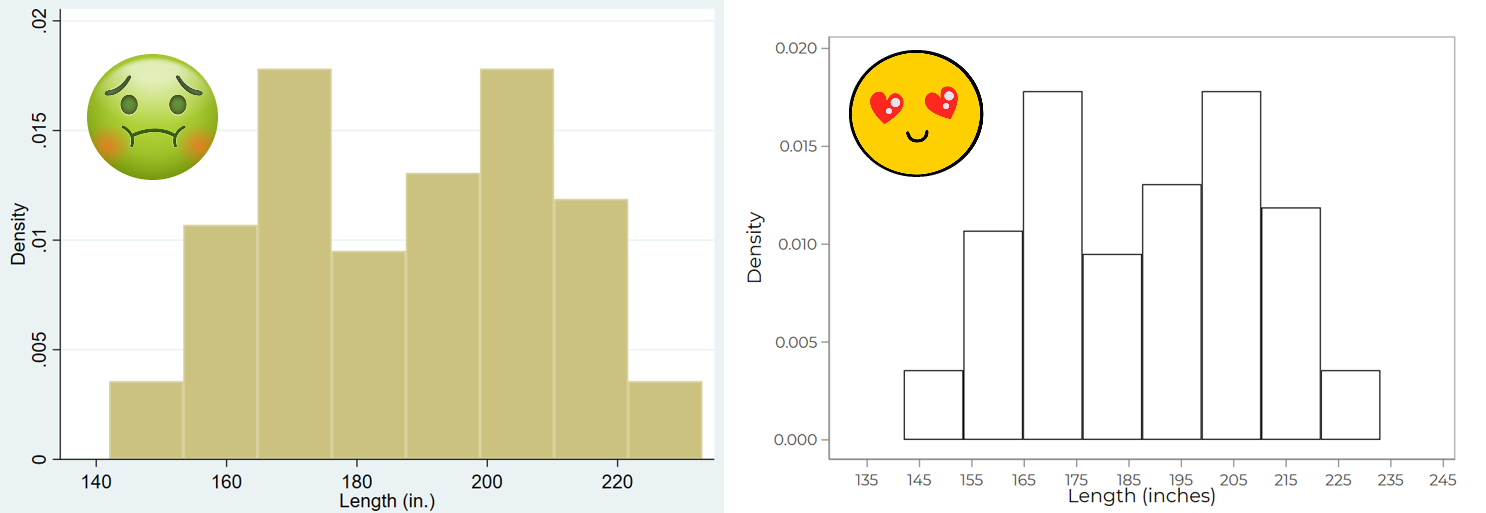
Making graphs is one of the best parts about being a social scientist. The problem with graph-making, however, is that software interfaces are opaque. In the case of Stata, program .readme files, while often well-documented, usually lack informative notation regarding what the component syntax pieces actually do. As a result, most people rely on the standard graphing defaults, which produce graphs that are not very aesthetically pleasing.
Use the below guide and the annotated code to build better graphs. Much of this is plug-and-chug, so all you’ll need to do is loop the syntax into your graphing code. Good luck!